Liver and myocardial iron overload
LIVER IRON CONTENT
Quantification of high liver iron concentration
(> 300 µmol/g dw/w)
by Magnetic Resonance Imaging :
Add-in sequence to
Gandon's protocol
Purpose
:
Measurement of high liver iron concentration (LIC) with a routine MR
scan at
1.5 T
Iron overload decreases signal intensity of the liver while muscle signal intensity remains unchanged. By measuring signal intensity ratio between liver and paraspinal muscle, it is possible to obtain an estimation of LIC. After RF excitation of the liver, the signal is recorded during the echo time (TE). For slight liver iron overload the decrease in signal intensity is depicted only for long echo time while the signal intensity of the liver remains unchanged for short TE. For high iron overload, the signal intensity of the liver decreases with short TE while the signal intensity is zero on long TE. Therefore several acquisitions with different TE are necessary to calculate the liver iron concentration.
Gandon et All (1) described 5 sequences to calculate LIC up to 375µmol/g dw with a TE of 4 ms or longer. For higher concentration, in particular in hematologic diseases, it is necessary to use a shorter TE. We describe here a sequence with TE = 1.8 ms that allow quantification up to 800 µmol/g dw.
This 6th sequence must be performed in all patients when LIC calculated with Gandon's protocol is above 300 µmol/g dw.
MR sequence for high iron concentration (1.5 T)
Parameters
Gradient echo sequence - TE = 1.8 ms - TR = 48 ms - Flip = 60°
Thickness = 15 mm - FOV = 450 mm - breathold
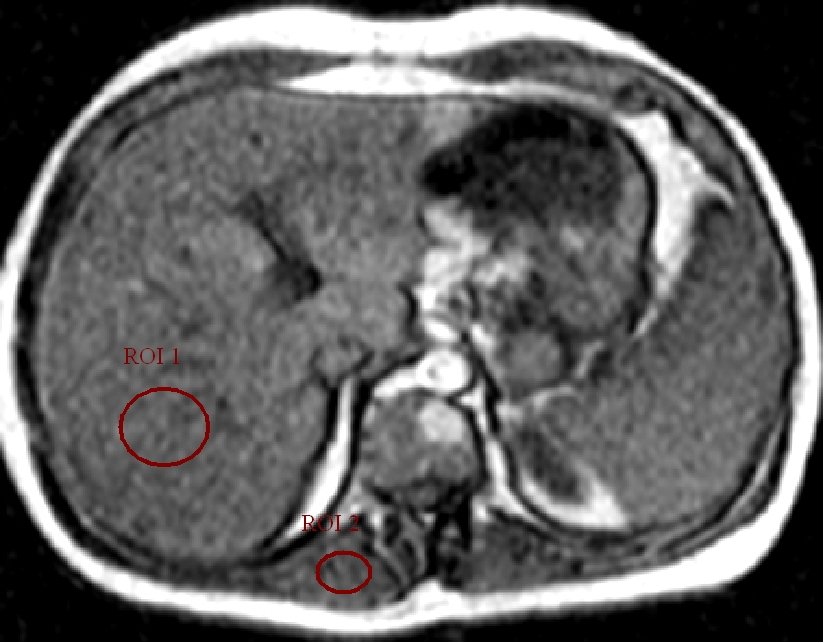
Measurement of signal intensities
Calculate the signal intensity of the liver (siL) and the signal intensity of the paraspinal muscle on the same slice (siM) and siL/siM ratio.
Liver Iron Concentration
To obtain the liver iron concentration (> 300 µmol/g dw) use the following formula :
Liver Iron Concentration µmol/g dw = 937 - (537 x siL/siM)
Liver Iron Concentration mg/g dw = 52.6 - (30.2 x siL/siM)
You an use the following software to compute iron concentration (freeware, windowsr)
Iron overload decreases signal intensity of the liver while muscle signal intensity remains unchanged. By measuring signal intensity ratio between liver and paraspinal muscle, it is possible to obtain an estimation of LIC. After RF excitation of the liver, the signal is recorded during the echo time (TE). For slight liver iron overload the decrease in signal intensity is depicted only for long echo time while the signal intensity of the liver remains unchanged for short TE. For high iron overload, the signal intensity of the liver decreases with short TE while the signal intensity is zero on long TE. Therefore several acquisitions with different TE are necessary to calculate the liver iron concentration.
Gandon et All (1) described 5 sequences to calculate LIC up to 375µmol/g dw with a TE of 4 ms or longer. For higher concentration, in particular in hematologic diseases, it is necessary to use a shorter TE. We describe here a sequence with TE = 1.8 ms that allow quantification up to 800 µmol/g dw.
This 6th sequence must be performed in all patients when LIC calculated with Gandon's protocol is above 300 µmol/g dw.
MR sequence for high iron concentration (1.5 T)
Parameters
Gradient echo sequence - TE = 1.8 ms - TR = 48 ms - Flip = 60°
Thickness = 15 mm - FOV = 450 mm - breathold
Measurement of signal intensities
Calculate the signal intensity of the liver (siL) and the signal intensity of the paraspinal muscle on the same slice (siM) and siL/siM ratio.
Liver Iron Concentration
To obtain the liver iron concentration (> 300 µmol/g dw) use the following formula :
Liver Iron Concentration µmol/g dw = 937 - (537 x siL/siM)
Liver Iron Concentration mg/g dw = 52.6 - (30.2 x siL/siM)
This
formula is based on 24 biopsies
with an excellent correlation ( R = -0.85 ).
You an use the following software to compute iron concentration (freeware, windowsr)
1 Gandon Y, Olivie D, Guyader D, Aube C,
Oberti F, Sebille V, Deugnier Y.
Non-invasive assessment of hepatic iron stores by MRI.
Lancet. 2004 Jan 31;363(9406):357-62.
2 Rose C, Vandevenne P, Bougreois E, Cambier N, Ernst O
Liver iron content Assessment by routine and simple Magnetic Resonance Imaging (MRI) procedure in higly transfused patients.
European Journal of Haematology (Submitted)
Authors
Olivier ERNST Université Lille II (France)
Christian ROSE Université Catholique de Lille (France)
01 - 2006
Key words : liver iron hemochromatosis thalassemia MRI magnetic resonance imaging quantification